Truman Manifolds
AI may be the first real test of conclusions inherited and never checked. A terrain map of research fields and US jobs shows where that ground has already given way.What is left when the ridges between domains wear down?If domains are basins held apart by ridges, AI is the erosion wearing those ridges down, and telos, what a thing is for, is the ground that does not drain. The argument starts from one anonymous comment and is unverified; the measurement is the platform’s own.Truman Burbank, The Truman Show — Truman finds the edge of the set by walking into it.
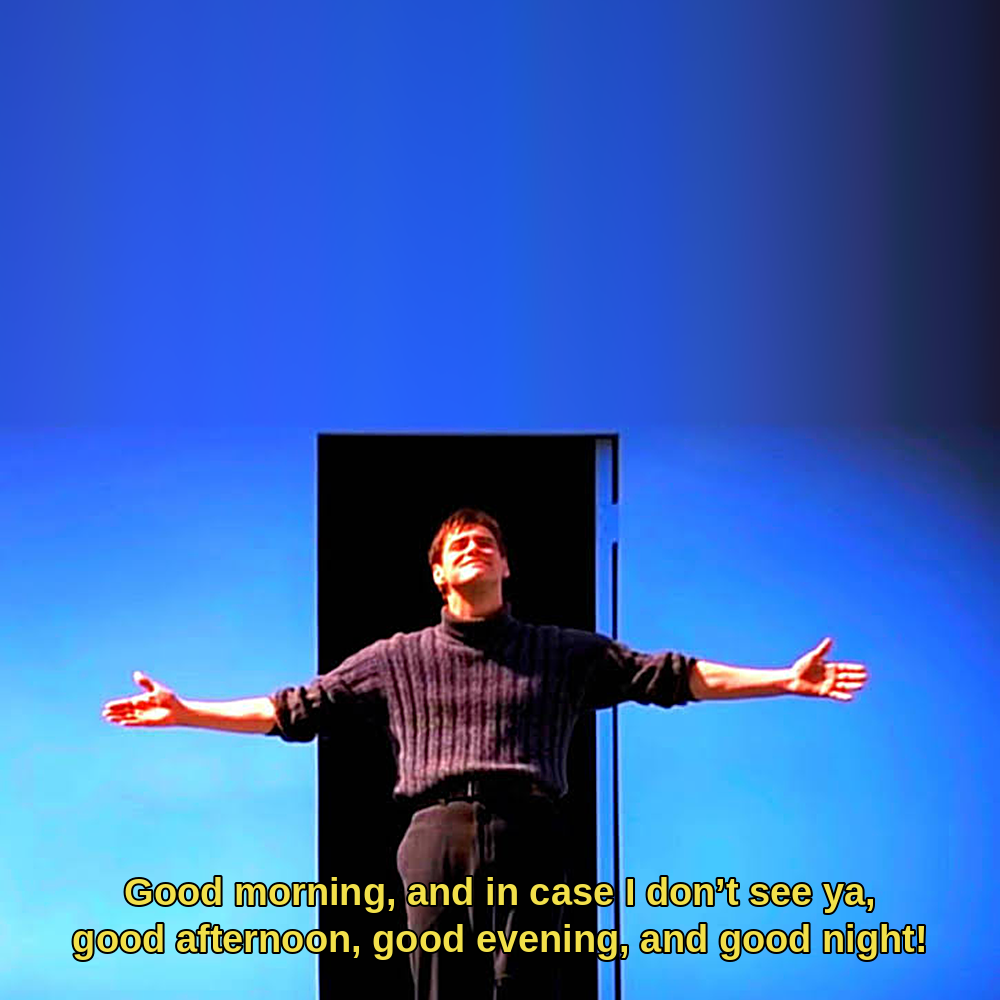 Subtitles on the image read: “Good morning, and in case I don’t see ya, good afternoon, good evening, and good night!”
Truman Burbank lived his whole life in Seahaven, a town that looked complete to him because he had never been to its edge. In The Truman Show the edge turns out to be a painted wall, and everything inside it had been arranged for him. Much of what people rely on was arranged the same way, handed down and never worked out: the law, the idea of fair play, the shape of a career, the way a market pays for work. In late August 2026 an anonymous comment on Reddit, in a thread about when AI models will reach new capabilities, argued that AI is the first real test of that inheritance. It came as eight headed notes, plus a short clarification of two of them when asked, and none of it has been verified. This piece restates the argument, then measures the one part of it that can be measured: the wear on the ridges between research fields and between US industries.
A lifetime, or a few family generations, covers about a century of change, and that century is the lens most people judge change through. Against geological time (eons, eras, periods, epochs) a century barely registers, yet people generalise from it to the whole. The comment’s name for what AI brings to that frame is “ontological shock”, a shock to what people take as simply real.
The comment likens that inheritance to milk fed to an infant: expectations taken in without examination, such as the law of the land, opportunity, fairness and human rights. The objection is to the process, not to the ideas, which the clarification called wonderful. Nobody did the hard work of building themselves and their societies around them. People found the ideas in place and took that as proof they were philosophically and rationally sound, much as Truman took the town he woke up in.
When knowledge and intelligence start moving, which may happen in the near to medium term, the expectations nobody built go bad first, and the people standing on them are the ones worried or hurt.
Isaac Asimov described prejudice as handing a person conclusions ready-made. A rule written for a machine shows what is missing. A detector (a written rule that fires on a condition) has a date, a price for its upkeep and a way to be challenged; a prejudice has none of them.
How long a conclusion has gone unchecked sets the cost of checking it. A threshold set last month can be dated and revisited. A century of ordinary life that never broke is harder to date and far more expensive to reprice.
Repricing starts with what sits under the frame, in a layer nobody surveys. Kant split the world into things as they appear (phenomena) and things as they are in themselves (noumena). Geology has the same split. Regolith, the loose layer of soil and broken rock on top, can be surveyed; the bedrock below it has not been.
Kant’s picture is used here only as the layer nearest to bedrock, deeper than any creed, without the rest of his philosophy.
- Regolith
- The perceived layer of appearances and phenomena, the news included. It is the only layer anyone observes.
- Bedrock
- Stood on and never inspected: Kant’s noumena, and in practice the assumptions older than the arguments that rest on them.
Bedrock is found only when something on top of it gives way. Truman’s first sign was a studio light falling out of a clear sky onto his street.
On top of that bedrock, knowledge, information, economics and the rest have a shape, and it is a landscape. Each domain is a basin, held apart from its neighbours by ridges. A market economy, for example, is a lake fed by the middle class, the higher ground that drains into it, and the professions sit in smaller pools beside it. Fields of study, trades, economies and ecosystems are other lakes on the same surface.
Repeated outcomes settle in basins, the way a million raindrops show where the water goes. Attention is best spent where a small change can still send the path to a different ending.
A ridge is what keeps two basins apart, and its height says how independently the two sides move. Two fields whose fortunes rise and fall together have little between them; two that move on their own are walled off. The basins also show where things come from, such as fields fed by enrolment and trade. Seahaven’s ridge was water: Truman was raised to fear it, and the fear held him in better than any wall.
Basin and ridge, at rest and cut
A ridge can also wear down.
Suppose the high ground weathers down to a smooth alluvial plain, and the edges of the ponds and lakes are scoured through, draining them to the basin below. Water finds the lowest point, the one closest to bedrock. Erosion consolidates the domains and exposes new bedrock: knowledge, information and philosophy about the world. Skills, markets and economies have always shifted with conditions like these, but not at this speed.
Erosion from watershed to bedrock
- Watershed. Ridges hold the water in their folds, and each domain keeps to its own basin.
- Plain. The watershed weathers down to a smooth alluvial plain, and the ridges wear to saddles.
- Breach. The edge of a pond or lake is scoured through and the water does not come back. This is the stage the second half measures.
- Bedrock. The water drains to the lowest point, the one closest to bedrock, and domains that competed by staying separate end up competing on depth.
Nobody decides anything in the four stages; each follows from the one before. Truman’s boat makes the last stage literal, its bow going through a sky that turned out to be painted.
On this picture a basin is not permanent. It is a shape on a surface that is still weathering.
Security is the one place the argument offers something that looks checkable. The comment calls a recent turn in security the Claude Mythos epoch, after an AI model, and treats it as its touchstone: a shift in how the security of everything digital must now be examined. It says industry and academic reports on security maturity before that turn, from small firms up to enterprise and government, mostly found “utilitarian apathy” to be the status quo, but it names none, so the claim is unchecked.
the only novel aspect was that all of a sudden we were naked for ‘acting like’ rather than practicing what we preach— Anonymous comment on r/accelerate, August 2026
Everyone in Seahaven but Truman was acting, and the town held only while nobody was caught at it. Security had run the same way. GRC (governance, risk and compliance) let an organisation act secure without practising it, and the turning point was being caught. In the basin picture that is a basin erosion event: the practice turns out to have been the exposed part all along.
Everything so far restates an argument and measures nothing. Its geology can be measured, though, and the platform measured it on two monthly data sets running from 2010. Knowledge is OpenAlex works per subfield, worldwide, each paper counted once under its main topic. Employment is US jobs per industry from the Current Employment Statistics (CES) survey. Each data set is a sheet, and every field or industry is a cell holding a share of its sheet’s total.
A cell that gains share sinks into a deeper basin. The ridge between two neighbours stands as high as they move independently, r = (1 − correlation) / 2, which is 0.5 when the two are unrelated and wears towards a flat saddle as they move together. The parent in each data set’s own hierarchy is the watershed, and a breach is a sustained loss of share, drawn below. Exact definitions are in the glossary at the end.
Position is a survey taken once, like walking to the edge of the set to find where the walls stand. Cells were laid out by how they moved together in 2010–16 and never move again, so where a cell sits carries nothing from after 2016.
What counts as a breach
From every quarter starting in January 2013, a model forecast each cell’s depth a year ahead and its chance of a breach. It was gradient-boosted, refitted at each date only on rows whose outcome was already known, and scored against two simple rules: no change, and momentum (last year’s slope carried forward). Six hypotheses, each with the rule it had to pass, were written down before the run. Both sheets stop in October 2025, for reasons given in the method at the end.
Both sheets play on one map, knowledge above employment, on one date and one timeline. The map plays when it scrolls into view, quarterly from January 2013 through the four forecast quarters, and starts again; it pauses when it leaves the screen or the reader takes hold of it, and with reduced motion set it waits for the play button. The controls are a street map’s: drag to pan, pinch or hold Ctrl or ⌘ with the wheel to zoom, right-drag or twist two fingers to tilt and turn. Detail follows the zoom, out to domains or supersectors and in to subfields.
Knowledge and employment terrain
- Basin to ridge; strong tie to weak
- Breach, torn cell
- Stress on a low boundary
- The model, where it differs
- Share flowing between neighbours
Under the panels a ticker lists what happens at the current date on both sheets, newest first: a breach and where it drained, a thread that snapped, a cell the model flagged, a breach caught or missed. Clicking an entry flies the map to that cell, and hovering on a cell gives its exact numbers. Under it a scoreboard counts each sheet’s year after the date (breaches, cells flagged, caught, missed and false alarms, and the hit rate against the base rate) and the whole run (the model’s AUC against momentum, the gap with its interval, and the contagion ratio with its p). A filled square marks a result significant at 5%.
Each sheet is a square of cells, one per field or industry, drawn as relief in a line wireframe; past the square the relief eases into level ground that carries no data. A cell sinks into a basin the more its share has grown since the survey, and ridges stand between neighbours at a height set by how independently they move; a worn ridge sinks to a saddle. Line colour follows elevation alone, indigo in the basins to aqua on the ridges, and carries no data of its own. Nothing on either sheet is filled.
Two sheets in relief
Employment shares move one way and do not come back, so that sheet carries more on its relief. A cell losing jobs rises towards its ridges. A thread is the boundary two industries share, laid along the ridge between them, heavier and stronger in colour the more their share changes move together. It is drawn snapped when two industries tied at the first reading no longer are, and a cell is drawn torn from the date of a confirmed breach, its basin ring in pink and open towards the neighbour that gained, and stays torn.
Thread and cell states
The map always draws what happened in the year after the date on the timeline, and draws the model in lavender only where it parts from that, as a surface on both sheets. The gap between lavender and ink is the model’s error. Where the model was right the lavender lies on the ink and drops out of sight; a miss leaves lavender standing over a breach drawn in pink, and a false alarm leaves lavender fallen with no pink.
On both sheets pink is a breach, the place where a wall was actually reached, and tangerine is stress on a boundary (the top tenth at that date). A front spreads from a breach to its neighbours over about six months, and ink dots moving along a boundary carry share across it. After October 2025 the map shows the forecast alone, whose out-of-sample error is about 15% for knowledge and 7% for employment.
The run gives four results. The clearest is that research sloshes and employment flows. The momentum coefficient, which says whether last year’s change carries on or reverses, was fitted only on the past at each date and was negative for knowledge at all 46 quarterly dates and positive for employment at all 47. A field whose share rose over the last year tends to give some of it back the next, and an industry that grew tends to keep growing.
Hypotheses fixed before the run
| Hypothesis | Sheet | Estimate | Baseline | 95% CI | p | n | Verdict |
|---|---|---|---|---|---|---|---|
| Knowledge sloshes, employment flows | Knowledge | Momentum negative | — | — | — | 46 of 46 dates | Holds |
| Employment | Momentum positive | — | — | — | 47 of 47 dates | Holds | |
| Stress spreads to neighbours | Knowledge | RR 2.1 (3.9% vs 1.8%) | — | — | 0.024 | 491 vs 1,473 | Holds |
| Employment | RR 2.9 (3.7% vs 1.25%) | — | — | 0.20 | 163 vs 400 | Fails | |
| Ridges are stable | Knowledge | ρ 0.29, 20.7% worn | — | — | 0.001 | 661 | Holds |
| Employment | ρ 0.06, 15.8% worn | — | — | 0.20 | 196 | Fails | |
| Breaches flagged a year ahead | Knowledge | AUC 0.865 | AUC 0.872 | −0.09 to 0.08 | — | 35 breaches | Fails |
| Employment | — | — | — | — | 16 breaches | Too few | |
| Depth forecast beyond momentum | Knowledge | Skill 0.016 | Skill 0.002 | −0.10 to 0.12 | — | — | Fails |
| Employment | Skill 0.045 | Skill −0.034 | −0.06 to 0.28 | — | — | Fails | |
| Neighbours as a model feature | Knowledge | AUC change −0.012 | — | −0.035 to 0.003 | — | — | No gain |
| Employment | AUC change −0.017 | — | −0.094 to 0.011 | — | — | No gain | |
| Consolidation | Knowledge | Computer Science | — | — | — | 1 field | Measured |
| Employment | None | — | — | — | — | Measured |
Contagion in research
Of 491 subfields next to one that had just breached, 3.9% breached within the year, against 1.8% of 1,473 cells that were not neighbours, matched on the model’s risk. That is a risk ratio of 2.1, so a neighbour of a breach was about twice as likely to breach itself, with a permutation p of 0.024. Employment gave a ratio of 2.9 on 163 exposed cells, with p 0.20, too weak to tell from chance on a sheet that small.
A blind spot
Neither forecast did better than momentum. The breach model reached an AUC of 0.865 (a ranking score on which 0.5 is guessing and 1 is perfect) on 35 knowledge breaches, against 0.872 for a logistic on momentum alone, and 57% of those breaches were surges falling back, which momentum already expects. Employment had 16 breaches, too few to score. For depth, skill (how much a forecast cut the error of assuming no change) was 0.016 for knowledge against 0.002 for momentum, and 0.045 against −0.034 for employment; the bootstrap interval of the gap covers zero on both sheets. Giving the model its neighbours’ breaches as a feature did not raise its AUC on either sheet, so a break does travel along the mesh, and knowing so does not help call the next one.
A break does travel along the mesh, and knowing so does not help call the next one.
Ridges that hold
Ridge heights surveyed in 2010–16 still rank with those from 2020 on for knowledge (Spearman ρ 0.29, p 0.001), so its ridges hold; for employment the ranking barely survives (ρ 0.06, p 0.20). At the last date 19.6% of boundaries across both sheets are worn flat.
Five cases put the pooled results on single cells. Each plays a few dates on the same cells when it scrolls into view, and a small scoreboard under it sets the model’s forecast for each cell against what happened. The first three are on the knowledge sheet.
Infectious Diseases through COVID-19
2021-04 Share is 1.41%, 1.9 times its 2019-10 level. The model still predicts a 45% fall, and share falls 4%.
Artificial Intelligence rose more slowly than Infectious Diseases, and at each of its dates the model under-predicted it in the same way.
Artificial Intelligence rising
2023-01 Artificial Intelligence is 1.38% of works, up from 0.80% in 2017-01. Predicted up 0.2%, up 12% in the event.
Molecular Biology is the one case here with a flag that came true, and two of its neighbours breached after it.
Molecular Biology and its neighbours
2023-04 Cancer Research and Endocrinology, both neighbours of Molecular Biology, breach in the following year. Across all knowledge cells, neighbours of a breach breach 2.1 times as often as matched cells (p 0.024).
The last two cases are on the employment sheet, where shares fall and stay down, and the model flagged neither.
Leisure and hospitality in 2020
2020-10 After the fall the model predicts a further 12% loss of share for Leisure and hospitality. Share is flat, down 0.2%.
Coal Mining fell steadily and was twice confirmed as a breach.
Coal Mining in decline
2019-10 Predicted down 11%, down 14% in the event. At each of these dates the direction is right and the size short.
Read against the four stages of erosion, the verdict is split. Ridges wear and basins breach, and in knowledge the breaks spread to neighbours; all of it can be measured after the fact. None of it could be called a year early with more skill than a rule that says a surge falls back, at least by this model on these two sheets.
- Established
- Ridges wear and basins breach on both sheets. Research share sloshes back after a surge while jobs keep moving the way they went, and in knowledge a breach spreads to its neighbours, at a risk ratio of 2.1.
- Not established
- A year’s warning. The breach model’s AUC of 0.865 does not beat momentum’s 0.872, no depth forecast beats momentum on either sheet, and employment has too few breaches to score.
- Open
- Any cause. Drainage is bookkeeping, and an earlier test of whether knowledge leads employment was inconclusive (23 pairs, p 0.31), so the two sheets are kept apart, with no flow between them. Nothing here attributes a breach to AI.
This is what is valuable and transcends the above — rain or shine, Skynet or no Skynet.
Anonymous comment on r/accelerate, August 2026
Telos is Aristotle’s word for the final cause or inherent purpose of a thing. The telos of an acorn is to become a mature oak tree.
The comment leaves what is valuable unnamed. The nearest analogy is buying a house or a car, or making another major decision: what does due diligence look like over the near to medium term, without relying on what someone else says?
A handed-down conclusion is one where someone else did the working. Due diligence means doing the working oneself, on ground that will still be there after the basins drain. It works as a bedrock baseline of vigilance: always on, priced, and cheap enough that switching it off would be a decision rather than a saving, a floor kept whether or not anything is happening, applied to a whole life. At the wall Truman finds steps up to a door, and going through it is the one decision in the film nobody scripted for him.
One instrument for holding that floor is the Telos System, a set of printable planner and diary pages written up separately as a concept. It is a design and is not offered as evidence.
From counts to picture
Each step uses only what the step above produced. Everything up to step 3 is fixed by the survey; from step 4 on, each quarter uses only months up to that date, except the outcomes it is later scored against.
- Counts. Works per month for every OpenAlex subfield, summed to fields and domains; all employees per CES industry, with supersectors consistent with total nonfarm payrolls.
- Shares. Each cell’s count over its sheet’s total that month, so shares on a sheet sum to one. Depth is the log of the twelve-month mean share.
- Cells. A nested weighted Voronoi treemap of the square, built once on the 2010–16 survey. Each cell’s area is its mean survey share times its parent’s area, and children are seeded by how they moved together in the survey. The layout never moves again.
- Boundaries. Two cells that share a segment are neighbours. At every quarter each boundary gets a ridge r, from the correlation of the pair’s twelve-month share changes over the trailing 48 months, net of the sheet’s mean change, and is worn if r falls below the tenth percentile of 2,000 random pairs. Flow allocates each cell’s twelve-month change to adjacent cells that moved the other way, and stress is flow over ridge strength.
- Breach rule. Share over the next twelve months at most 0.75 of the last twelve (0.90 for employment), and the twelve after that still down. One episode per cell per 24 months; the neighbour that gains most is where it drains.
- Forecast and baselines. At every quarter from January 2013 a gradient-boosted model (LightGBM, 400 trees) is refitted per sheet on rows whose outcome was already known, for next year’s change in depth and for breach risk. It is scored against no change, against momentum (an OLS on last year’s slope) and, for breaches, against a logistic on the twelve- and six-month slopes.
- Contagion test. From 2017, the breach rate of neighbours of a fresh breach against up to three cells at least three boundaries away in the same decile of model risk, with a permutation p from 1,000 shuffles within strata.
- View. The map draws where the year after each date ended, and the model’s surface in lavender at the forecast change wherever the two part. After October 2025 each of the four forecast quarters adds a quarter of the forecast change.
Sheets and coverage
OpenAlex keeps adding works for months after they appear, so its latest months run short, and from November 2025 it also carries bulk-loaded records, with Nuclear and High Energy Physics taking 30–70% of a month’s works. A rule on totals alone (the last month whose classified count reaches 0.8 of the median of the six months before) lets those records through.
The series therefore stops in October 2025, before the first month from 2024 in which a subfield holds at least 5% of the month’s works and five times its trailing twelve-month median, in at least three of the next six months. What happened in the year after a date is known only up to October 2024, and whether a fall was a breach, which takes two years to confirm, only up to October 2023; later dates show the forecast alone.
Sheets, sources and coverage
| Knowledge | Employment | |
|---|---|---|
| Source | OpenAlex | BLS Current Employment Statistics, via FRED |
| Covers | Works by primary-topic subfield, worldwide | All employees by NAICS industry, US |
| Unit | Works a month | Employees |
| Top level | 4 domains | 13 supersectors |
| Middle level | 26 fields | 69 NAICS-3 industries |
| Finest split | 250 subfields | 28 NAICS-4 cells |
| Ends | October 2025 | October 2025 |
Boundaries by level
Boundaries and breaches by level
| Sheet and level | Cells | Boundaries | Worn | Tied | Snapped | Breached | Episodes |
|---|---|---|---|---|---|---|---|
| Knowledge, domains | 4 | 5 | 0 of 5 | — | — | 0 | 0 |
| Knowledge, fields | 26 | 55 | 6 of 55 | — | — | 2 | 2 |
| Knowledge, subfields | 250 | 661 | 137 of 661 | — | — | 39 | 44 |
| Employment, supersectors | 13 | 24 | 3 of 24 | 15 | 5 | 2 | 3 |
| Employment, NAICS-3 | 69 | 166 | 25 of 155 read | 78 | 30 | 15 | 19 |
| Employment, finest | 87 | 213 | 31 of 196 read | 112 | 38 | 18 | 23 |
Hypotheses in full
Each hypothesis with its test, the rule fixed before the run and the result on each sheet. Intervals are 95% block-bootstrap intervals over dates (1,000 resamples); matched controls sit at least three boundaries from any breach, in the same decile of model risk.
- Knowledge sloshes, employment flows
- Tested by the sign of the momentum coefficient (next year’s change on last year’s), fitted out of sample at each date. The rule asked for a negative sign at 80% or more of knowledge dates and a positive one at 80% or more of employment dates. Momentum was negative at 46 of 46 knowledge dates and positive at 47 of 47 employment dates. Holds.
- Stress spreads to neighbours
- Tested by the breach rate within a year for neighbours of a fresh breach, against matched non-neighbours, from 2017. The rule asked for a risk ratio above 1, a permutation p below 0.05 and at least 20 exposed. Knowledge gave 3.9% against 1.8% of 1,473 controls, a risk ratio of 2.1, p 0.024, with 491 exposed; employment gave 3.7% against 1.25% of 400 controls, a risk ratio of 2.9, p 0.20, with 163 exposed. Holds for knowledge only.
- Ridges are stable
- Tested by Spearman ρ between each finest-level boundary’s survey ridge (2010–16) and its ridge from 2020 on, and by the share worn at the last date. The rule asked for ρ above 0 with p below 0.01 over 1,000 shuffles, and a worn share between 10% and 60%. Knowledge gave ρ 0.29, p 0.001 over 661 boundaries, 20.7% worn; employment gave ρ 0.06, p 0.20 over 196 boundaries, 15.8% worn. Holds for knowledge only.
- Breaches flagged a year ahead
- Tested by the pooled AUC of the breach model against a logistic on momentum. The rule asked for an AUC of at least 0.75, a bootstrap interval of the gap above 0 and at least 20 breaches. Knowledge gave an AUC of 0.865 against 0.872 for momentum, a gap of −0.09 to 0.08, on 35 breaches, 57% of them surges falling back; employment had 16 breaches, too few to score. Fails.
- Depth forecast beyond momentum
- Tested by skill over no change (one minus the ratio of squared errors), model against momentum, pooled over dates. The rule asked for a bootstrap interval of the gap above 0. Knowledge gave skill 0.016 against 0.002, a gap of −0.10 to 0.12; employment gave 0.045 against −0.034, a gap of −0.06 to 0.28. Fails.
- Neighbours as a model feature
- Tested by the pooled breach AUC with and without the neighbour features, reported with no rule fixed. The change was −0.012 for knowledge (interval −0.035 to 0.003) and −0.017 for employment (interval −0.094 to 0.011). No gain.
- Consolidation
- Fields whose effective number of subfields fell 10% or more over five years, a measurement with no rule. One field (Computer Science) at the last date, and none on the employment sheet. Measured only.
Cases in numbers
Case dates, predicted and actual
| Cell | Date | Predicted | Actual | Flagged | Outcome |
|---|---|---|---|---|---|
| Infectious Diseases | 2019-10 | −4% | +65% | No | No breach |
| Infectious Diseases | 2020-07 | −54% | +31% | No | No breach |
| Infectious Diseases | 2021-04 | −45% | −4% | No | No breach |
| Organic Chemistry | 2017-01 | −6.6% | −28% | No | Breach, drains to Artificial Intelligence |
| Artificial Intelligence | 2017-01 | +1.2% | +4.6% | No | Gains most from Organic Chemistry |
| Artificial Intelligence | 2021-01 | −3.5% | +19% | No | No breach |
| Computer Vision and Pattern Recognition | 2021-01 | −2.5% | +19% | No | No breach |
| Artificial Intelligence | 2023-01 | +0.2% | +12% | No | No breach |
| Structural Biology | 2021-07 | −3.4% | −28% | No | Breach, drains to Molecular Biology |
| Molecular Biology | 2021-07 | +0.3% | +152% | No | No breach |
| Molecular Biology | 2022-04 | −57% | −46% | Yes, 49% | Breach caught, drains to Cancer Research |
| Cancer Research | 2023-04 | −16.2% | −39.1% | No | Breach, a neighbour of Molecular Biology |
| Endocrinology | 2023-04 | −31.7% | −41.5% | No | Breach, a neighbour of Molecular Biology |
| Leisure and hospitality | 2019-10 | −0.2% | −12.6% | No | Breach missed |
| Accommodation | 2019-10 | +0.2% | −19% | No | No confirmed breach |
| Accommodation | 2020-04 | −13% | −31% | No | No confirmed breach |
| Food Services and Drinking Places | 2020-04 | −12% | −10% | No | No confirmed breach |
| Leisure and hospitality | 2020-10 | −12% | −0.2% | No | No breach |
| Coal Mining | 2014-07 | −9% | −11% | No risk score yet | Confirmed breach |
| Coal Mining | 2019-07 | −5% | −10% | No, risk near zero | Second confirmed breach |
| Coal Mining | 2019-10 | −11% | −14% | No | Inside the 2019-07 episode |
- Cell
- An OpenAlex domain, field or subfield, or a CES supersector or NAICS industry, on both sheets. Area = its mean share of works or US jobs in the survey window (2010–16), nested inside its parent. Read from cells.poly and cells.area.
- Watershed
- The parent in the data’s own hierarchy: domain, field and subfield in OpenAlex; supersector and industry in CES.
- Basin
- A cell’s depth is its share of its sheet, as the log of its twelve-month mean. A cell that gains share sits lower, the way a lake deepens as it fills. Drawn as the change since the survey window, h − h0, where h0 is the log mean share over that window, on both sheets. Read from cells.h and cells.h0.
- Ridge
- How independently two neighbouring cells move: one minus the correlation of their twelve-month changes, halved, over the trailing four years, after the sheet’s common movement is taken out. A ridge below the tenth percentile of 2,000 random pairs at the same date counts as worn flat, a saddle. Read from edges.r and edges.worn.
- Line colour
- Elevation only, a reading aid, on both sheets: indigo in basins to aqua on ridges, from depth and r.
- Thread
- The boundary two industries share, laid along its ridge on the employment sheet. Weight and colour strength = tie = max(0, 1 − 2r), the positive correlation of their twelve-month share changes; indigo when strong, aqua when weak. Read from edges.r.
- Snapped thread
- A tie that has gone, on the employment sheet: r below 0.4 at the first reading and 0.55 or more now. Read from edges.r.
- Torn cell
- A confirmed breach, on the employment sheet. From the breach date on, open towards the neighbour that gained; stays torn. Read from cells.br = 1 and cells.sink.
- Breach
- A sustained loss of share. The next twelve months average at most 0.75 of the last twelve (0.90 for employment), and the year after stays down. Drawn pink on both sheets. Read from cells.br.
- Drainage
- The neighbour that gained the most share over the breach year. Share on a sheet sums to one, so this is bookkeeping and says nothing about cause.
- Consolidation
- A field whose effective number of subfields, the exponential of the entropy of their shares, falls over time.
- Tangerine
- Stress on a boundary, on both sheets. Flow over ridge strength, |f| / (total × (r + 0.05)); top decile at the date. Read from edges.tau.
- Front
- Spread from a breach to its neighbours, on both sheets, moving out from the breach over about six months. Read from cells.br, edges.a and edges.b.
- Ink dots
- Share moving across a boundary, on both sheets. Flow f, each cell’s twelve-month change allocated to adjacent cells that moved the other way. Read from edges.f.
- Lavender
- The model, on both sheets. Predicted surface at the forecast change, drawn where it parts from what happened. Read from cells.dh_hat.
Sources
The essay, from A century-wide frame to Caught acting, and What does not drain at the close, is a plain restatement of one anonymous comment in the d/rksci house voice. It measures nothing and is not evidence for the frame it restates, and the source’s substantive claims are unchecked. The two quotations are the comment’s own words, marked assumed below, and so are the coined terms in quotation marks. Three ideas in it come from this site’s earlier pieces, listed below: detectors against prejudice and the bedrock baseline of vigilance (Anxiety Kernels), and attention spent where a small change still matters (Too Much World); all were published before the comment, with no sign its author read them. The terrain is an exploratory run with verdict rules fixed before it, on data ending in October 2025. The numbers are from the terrain export of November 2026, and the map draws a trimmed copy of the same export. The model and baselines are scored out of sample at every date; nothing on the map is fitted to what it shows.
- The Truman Show (1998), directed by Peter Weir, written by Andrew Niccol, Paramount Pictures · the hero still, extended with sky and re-subtitled for commentary
- Immanuel Kant · the noumenon as the layer beneath appearances; the source’s own restatement is regolith over bedrock
- Aristotle · telos as final cause; the acorn and the mature oak are the source’s own example